
What Are Attack Trees?
Attack trees are a a form of attack modelling technique used to represent the sources, causes, and results of a potential or theoretical cyber-attack. Generally we refer to these figures as “attack trees” but you may see them referred to as “attack graphs,” as well, and fall within the larger field of threat modeling. This can be applied to products as well as attacks, and deals with assets, threats, and vulnerabilities. The larger field of risk management plays an important part here, as you can imagine.
One popular framework for engaging in threat modeling is STRIDE (see below). There are others, some more popular or useful than others depending on the context (Conklin, 2022). (The DREAD model, for example, includes “Discoverability,” which is generally frowned upon as it implicitly encourages obfuscation-as-security.) For application security, an Application Security Framework (ASF) might be more useful, for example. Whatever the threat model is, attack trees are meant to be a functional visualization, whether of the whole model or just one part.
Clearly, attack trees provide incredible value to a security team by providing a standard, agreed-upon, living document that helps determine where resources should go and which threats should be addressed in what order. By ideating, identifying, and approaching risks in a systematic way, it provides a meaningful method of approaching information security.
A condensed STRIDE framework based on Adam Shostack’s “STRIDE chart” on the Microsoft Security Blog (2007):
| Property | Threat | Definition |
|---|---|---|
| Authentication | Spoofing | Impersonating something or someone else. |
| Integrity | Tampering | Modifying data or code |
| Non-repudiation | Repudiation | Claiming to have not performed an action. |
| Confidentiality | Information Disclosure | Exposing information to someone not authorized to see it |
| Availability | Denial of Service | Deny or degrade service to users |
| Authorization | Elevation of Privilege | Gain capabilities without proper authorization |
Designing and Formatting
Now that we understand the general concept of attack trees and their value, let’s look at creating them. Designing and formatting of attack trees generally relies on two different conventions: nodes and edges. Nodes are the “stops” along the way, whether these are the user, a protocol, a vulnerability, a risk mitigation, and so on. Node shapes and colors can mean different things, which helps differentiation. In the basic example below, we can see there is very little flourish. It is meant simply to trace the path of a virus to demonstrate the attack vectors at each step. Edges are the lines that connect the nodes. These can denote the direction of intent by using arrows, the seriousness of the pathway with different line thickness or colors or patterns, even include notes about how this pathway could be taken (as demonstrated in the second example).
In some cases, simply presenting options and paths is enough. In others, you may need to weight the return on investment (ROI; how much this security solution would cost) versus the return on attack (ROA; the value of what a particular path could yield to an attacker). Methods of determining these values often fall within the Bayesian and Markov realms–a bit outside the scope of this piece–but can also be determined internally on an arbitrary, standard scale. It can even be as simple as “prohibitive/doable.” (See Lallie et al. (2020), for example.) It’s important to note here that there is no single correct method of attack tree design. It depends on the end goal, the team in question, and myriad other considerations.
Mermaid Examples
Here are two examples of attack trees. The first, as mentioned, is simple but understandable. The second gets more complex, including diverging via node color and shape, and methods included as notes mid-edge. Before we jump into just what Mermaid is and how it works, let’s look at these to see just what’s going on.
Example 1
This is a screenshot of an attack tree published in Han et al. (2023):

This is a rendered Mermaid version of the example above:
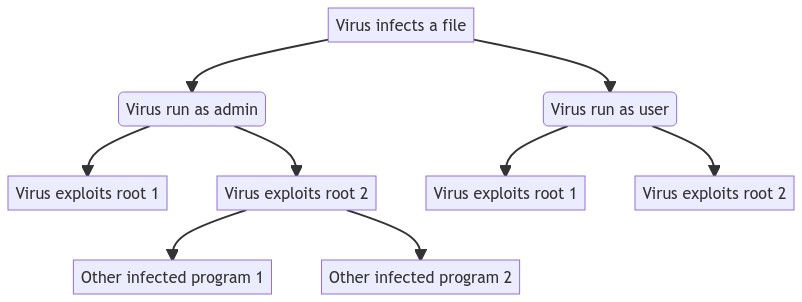
The code to create the example above is:
flowchart
    A[Virus infects a file] --> B(Virus run as admin)
    A --> C(Virus run as user)
    B --> D[Virus exploits root 1]
    B --> E[Virus exploits root 2]
    E --> F[Other infected program 1]
    E --> G[Other infected program 2]
    C --> H[Virus exploits root 1]
    C --> I[Virus exploits root 2]
Example 2
Mermaid chart generated from content presented in Gulhane et al. (2019):
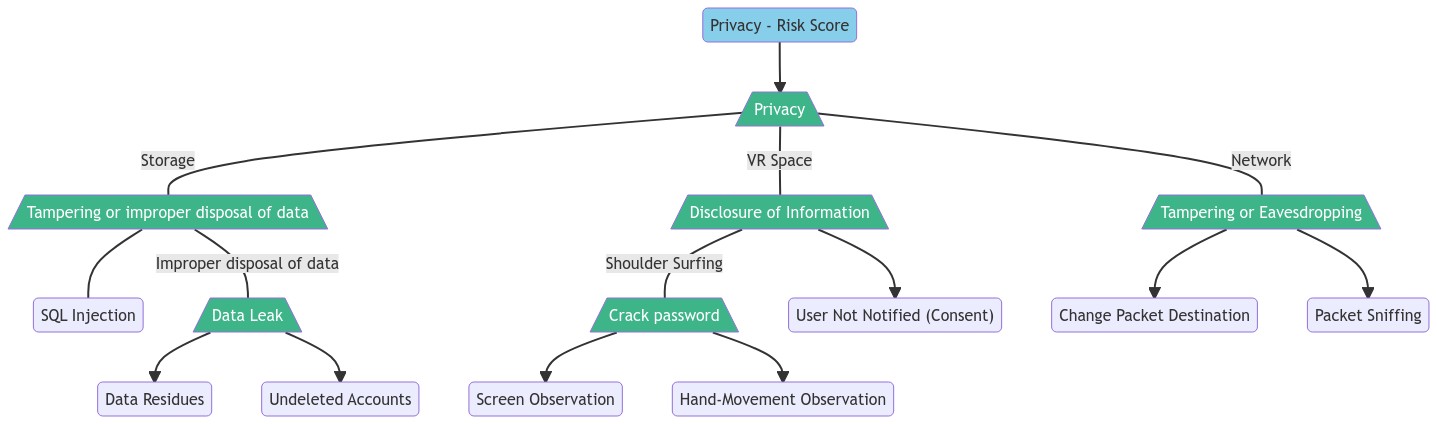
Now, let’s see how that one was made. I’ve included a variety of comments in the code to help explain exactly what’s going on. Note that flowchart TD simply tells Mermaid to display the graph top down. Other orientations are possible, as well, like LR, as demonstrated in the table below.
flowchart TD
%% Flowchart example of an attack tree
%% Based on Gulhane, Aniket & Vyas, Akhil & Mitra, Reshmi & Oruche, Roland & Hoefer,
%% Gabriela & Valluripally, Samaikya & Calyam, Prasad & Hoque, Khaza. (2019). Security,
%% Privacy and Safety Risk Assessment for Virtual Reality Learning Environment Applications.
%% doi:10.1109/CCNC.2019.8651847.

    A(Privacy - Risk Score) --> B[/Privacy\]

    B -- Storage --- C[/Tampering or improper disposal of data\]
    B -- VR Space --- D[/Disclosure of Information\]
    B -- Network --- E[/Tampering or Eavesdropping\]

    %% Left-most section
    C --- F(SQL Injection)
    C -- Improper disposal of data --- G[/Data Leak\]
    G --> H(Data Residues)
    G --> I(Undeleted Accounts)

    %% Center section
    D -- Shoulder Surfing --- J[/Crack password\]
    J --> K(Screen Observation)
    J --> L(Hand-Movement Observation)
    D --> M("User Not Notified (Consent)") %% Requires the label in quotes due to the parens

    %% Right-most section
    E --> N(Change Packet Destination)
    E --> O(Packet Sniffing)

%% Styling
    %% Color hex codes easily found at: https://www.color-hex.com
    %% Sets the "mint" colored class
    classDef mint fill:#3eb489,color:#fff

    %% Applies styling using 'style' and 'class' options
    style A fill:skyblue
    class B,C,D,E,G,J mint;
Placing sources and attribution in the code itself is never a bad idea, like in the first couple lines.
So, Why Mermaid?
Mermaid is a “JavaScript-based diagramming and charting tool that renders Markdown-inspired text definitions to create and modify diagrams dynamically” that uses plain text to create rich figures, graphs, and charts. As you can see from the coding examples above and below, it’s also easily human-readable, bordering on being a “literate” programming language.
The code for flowcharts (Mermaid also allows for creating a wide variety of other graph types like sequence diagrams, state diagrams, user journeys, Gantt charts, even Git graphs) is relatively simple, and full, comprehensive documentation available.
| Mermaid | Result |
|---|---|
A --> B |
 |
A(Apple) --> B(Orange) |
 |
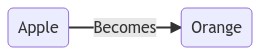
A(Apple) -- Becomes --> B(Orange) |
 |
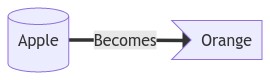
A[(Apple)] == Becomes ==> B>Orange] |
 |
There are a number of benefits to using Mermaid for creating this kind of dynamic content. First, Mermaid is open source, so there’s no proprietary platform that can hold your work or content hostage. Second, it’s plain text, so it’s lightweight, portable, and generates vector graphics, meaning scaling is not an issue. Third, it’s easily integrated into data science and reproducible reports created using Python and R, as well as knowledge base platforms that use markdown, like Obsidian (which is how the examples above were created). Fourth, easy to update when necessary with a text editor and a simple find-and-replace.
As a bonus, once you’re familiar with the general syntax of creating Mermaid graphs, you can begin adding variables into the nodes to automate much of the logistics within a system. (But we’ll save that for another time!) As yet another bonus, the Mermaid Live Editor allows for the real-time creation and visualization of Mermaid code, as well as easy sharing or downloading as images or code, importing of code via Gist, and archiving. You can find the SVG of Example 2 here as a demonstration.
I hope this little primer on attack trees and how to develop them using Mermaid is useful! More on threat modeling and what’s been presented here is offered in our Cyber Operations program, specifically in CYBV 435: Cyber Threat Intelligence.
References
Reuse
Citation
@misc{straight2023,
  author = {Straight, Ryan},
  title = {Developing {Attack} {Trees} with {Mermaid}},
  date = {2023-01-04},
  url = {https://ryanstraight.com/posts/attack-trees-in-mermaid/},
  langid = {en}
}